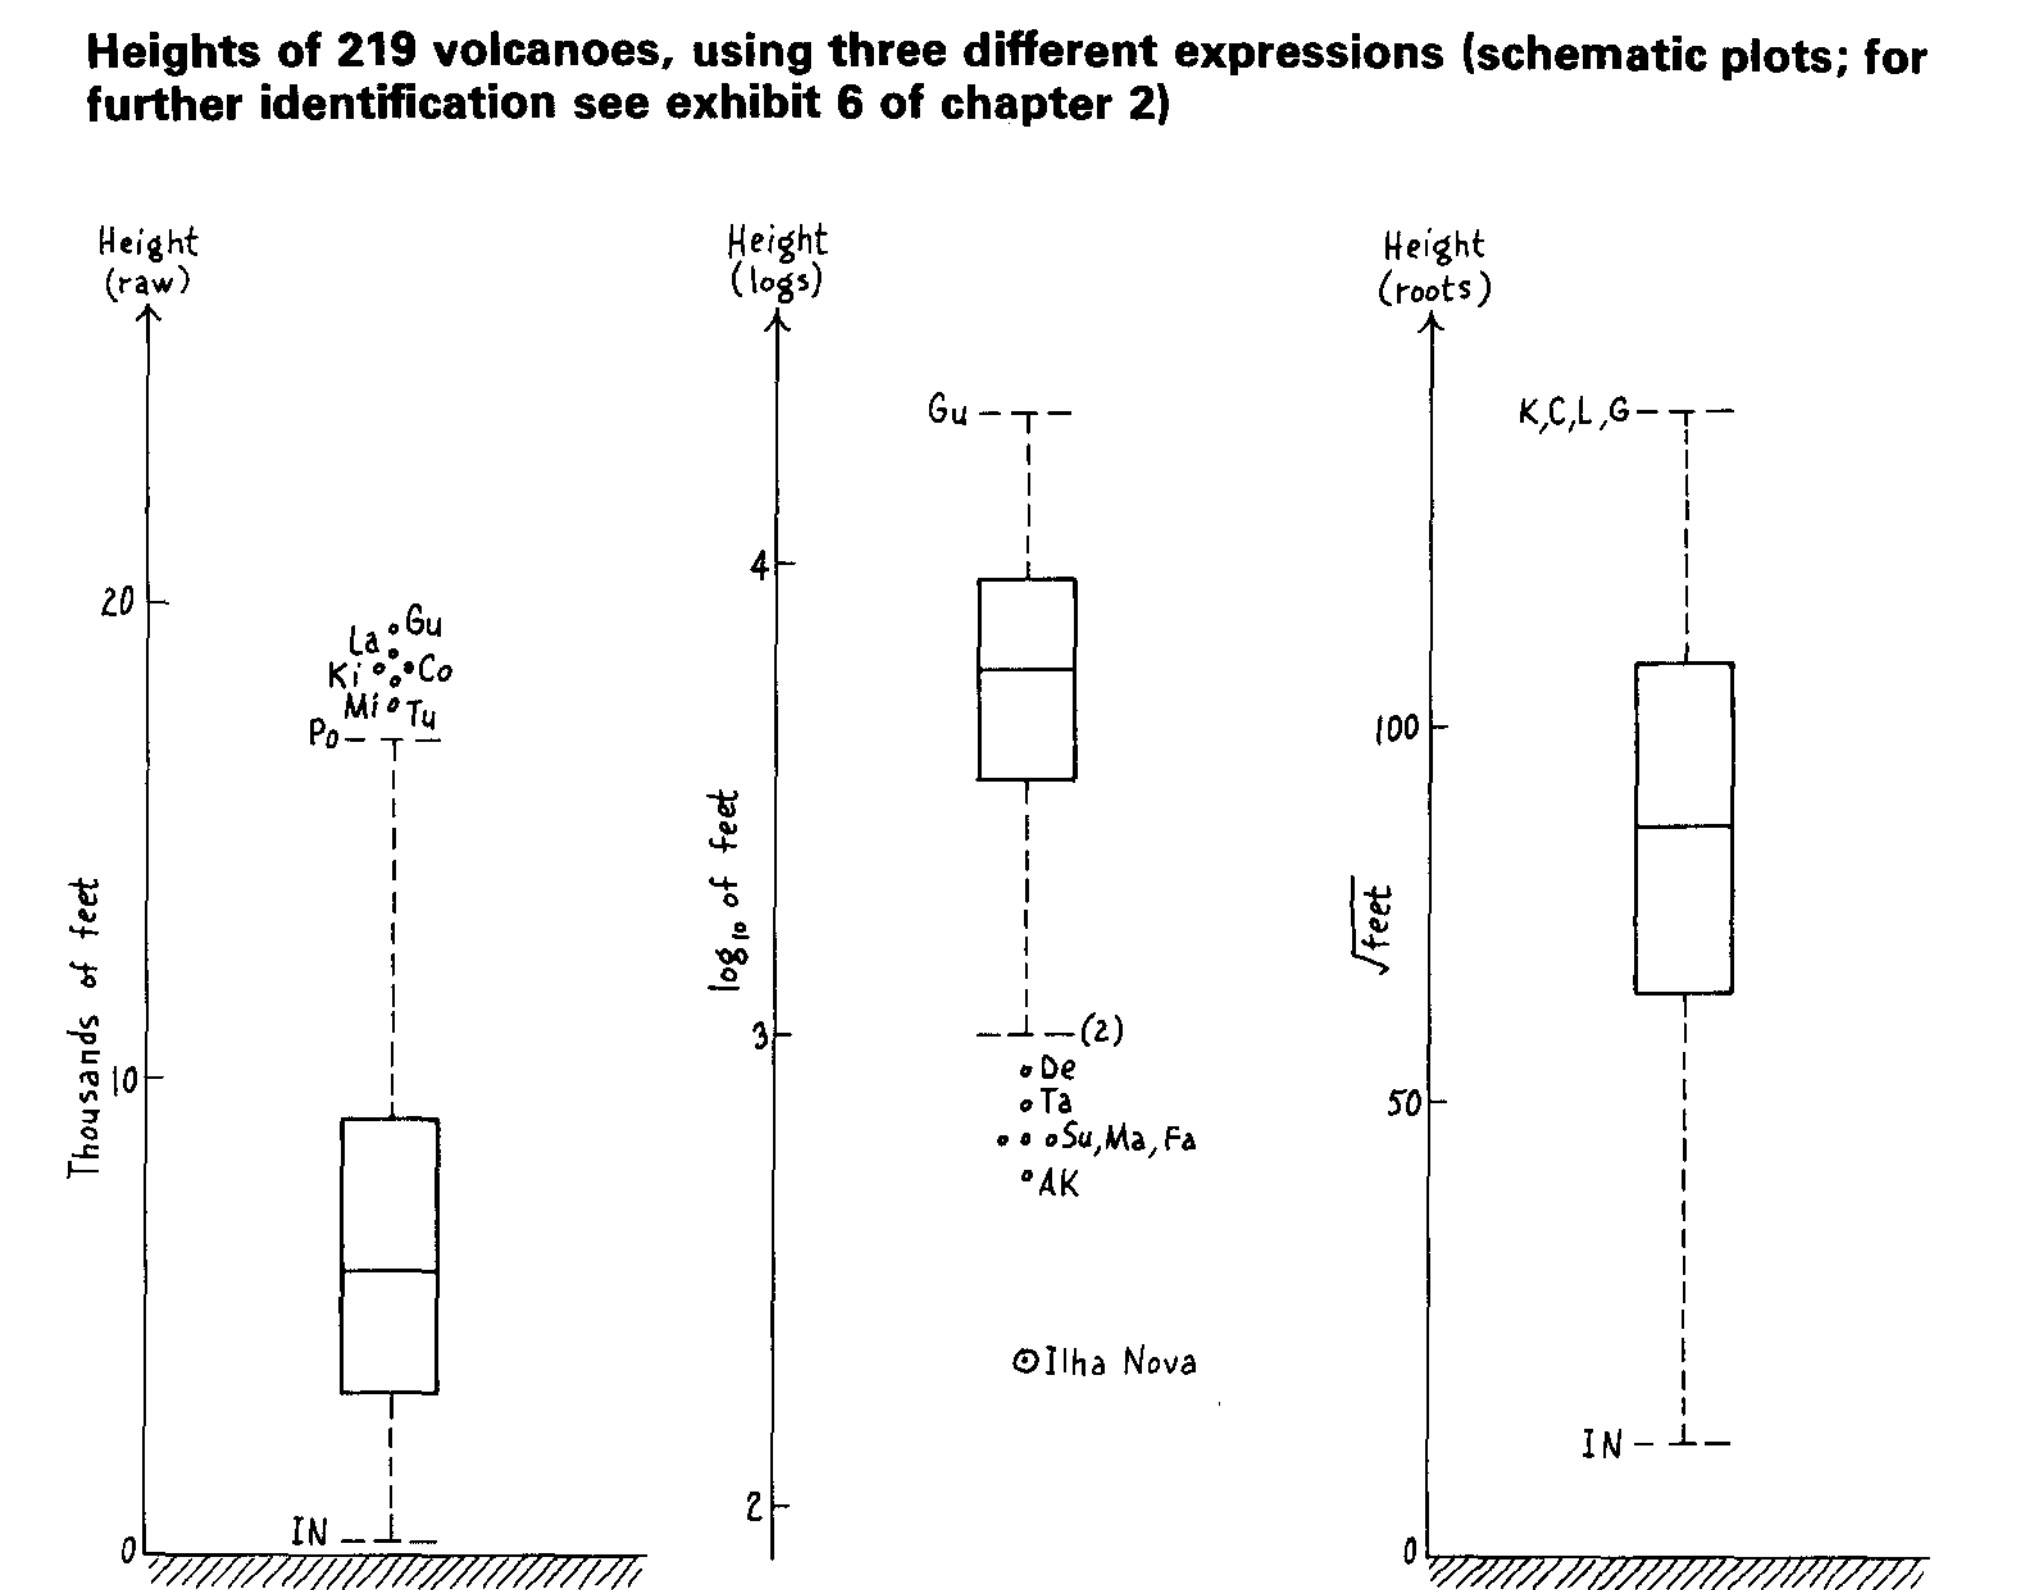
BOXPLOT
Year: 1977
Author: John Tukey
Book: Exploratory Data Analysis
The Boxplot is one of the main visual models used to explore data. It shows Summary Quantile Statistics and outlier for a stratified set of data.
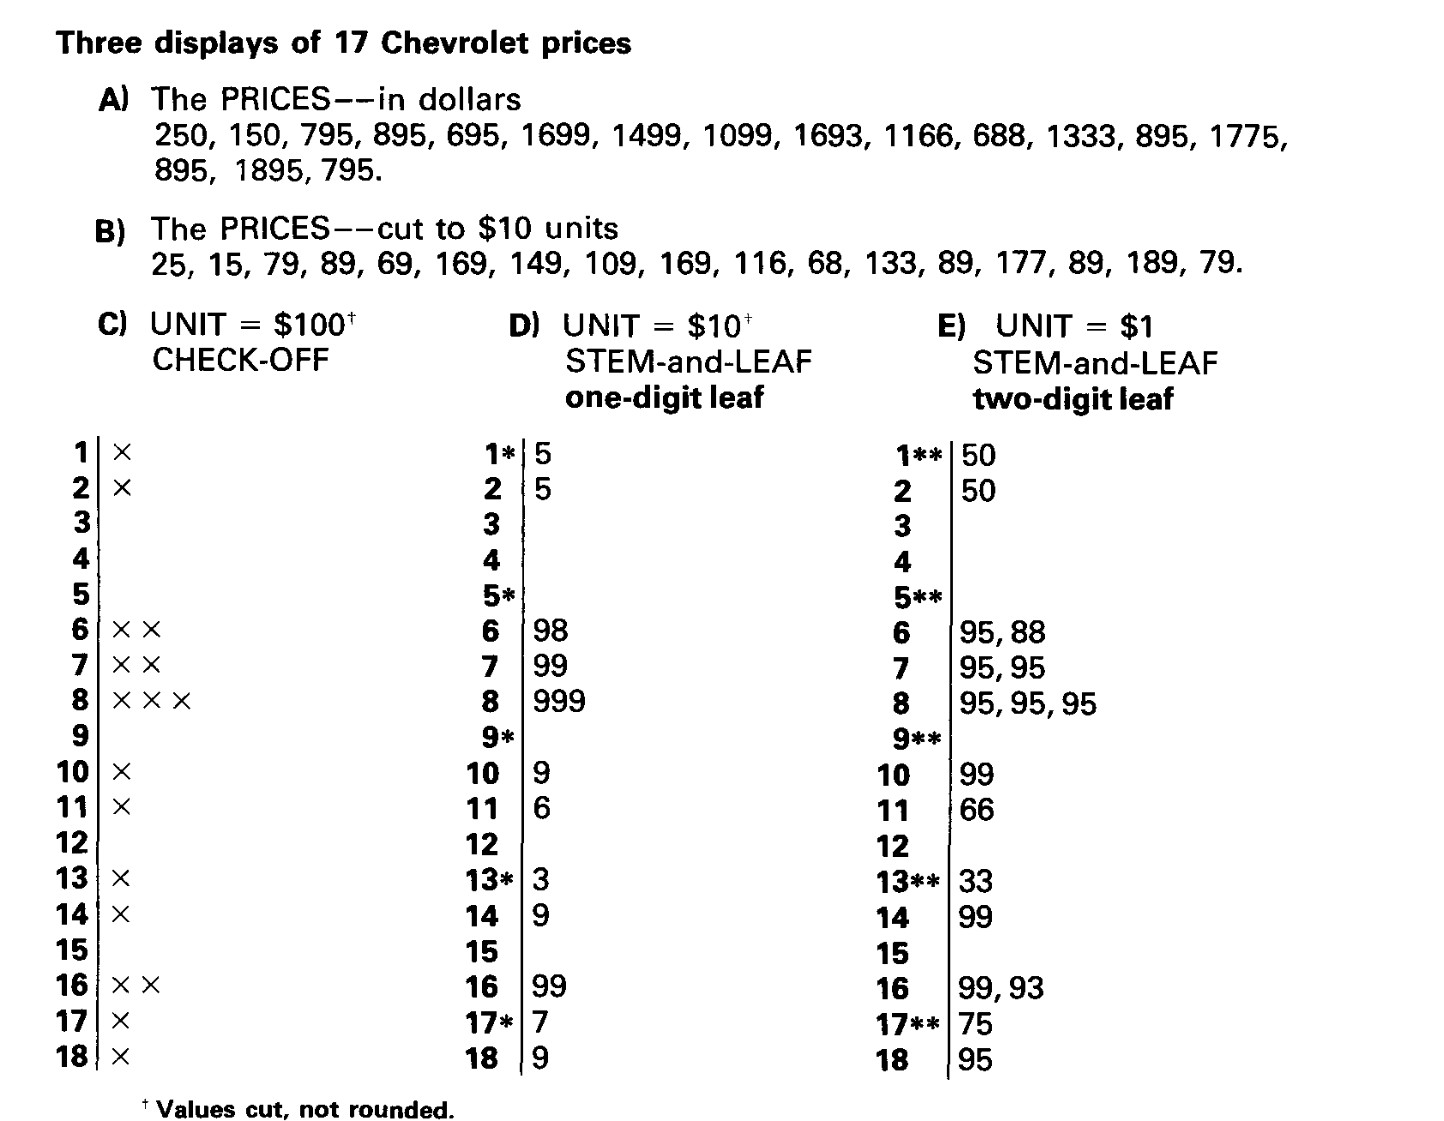
STEM AND LEAF
Year: 1977
Author: John Tukey
Book: Exploratory Data Analysis
A graphical intuitive representation of car prices.
A big part Tukey’s book “Exploratory Data Analysis” relies on graphical representation of data that you can draw yourself with pen and paper. Luckily today you can use powerful software designed for data exploration purpose, such as the Tidyverse.
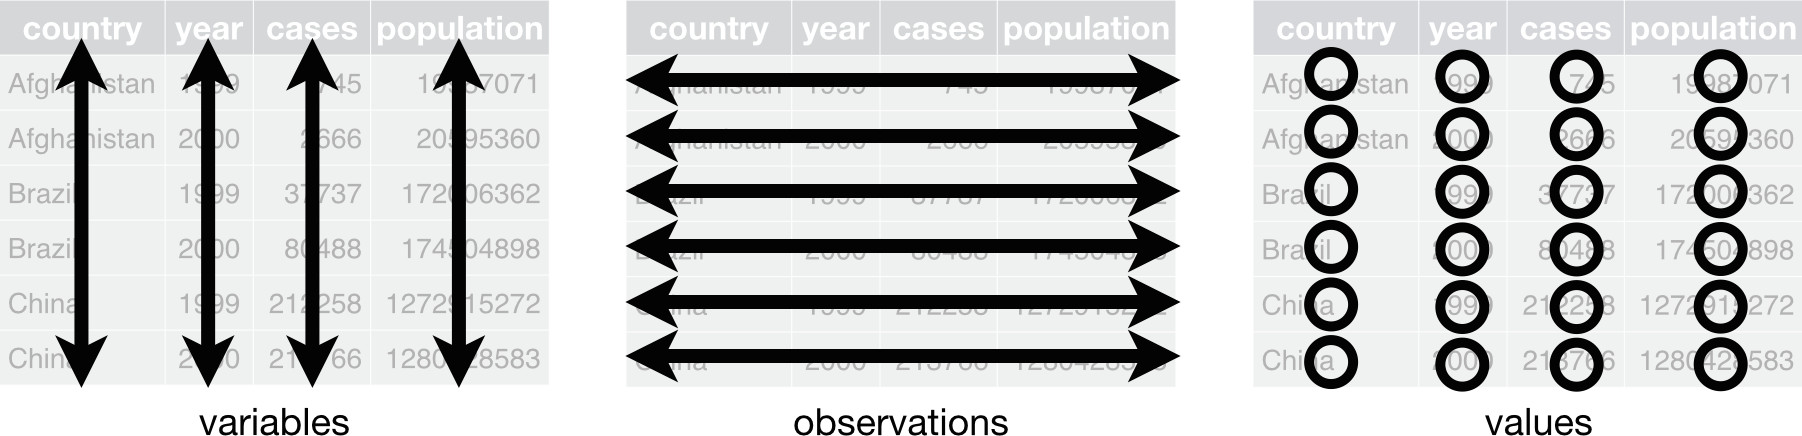
A common framework to organize data semantically: if you organize data based on their structure, it’s easier for you to make sense of them, to realize what data you have and what’s missing.
If you organize data with a common framework, it’s also easier to share them with others.
- Each column is a variable.
- Each row is an observation.
- Each cell is a value.
- Each dataset is one observational unit.
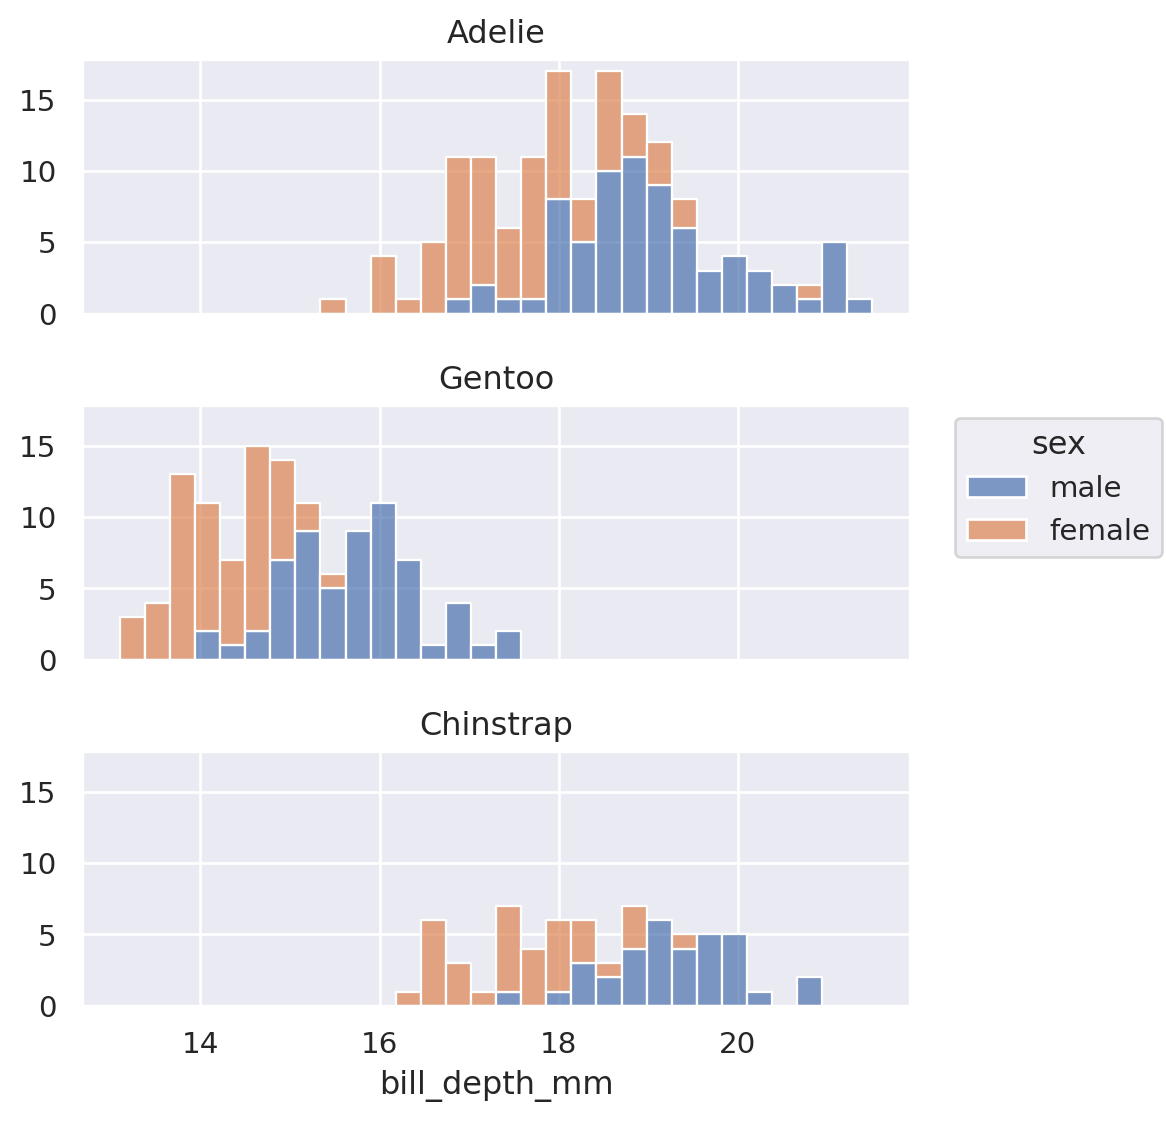
Histogram
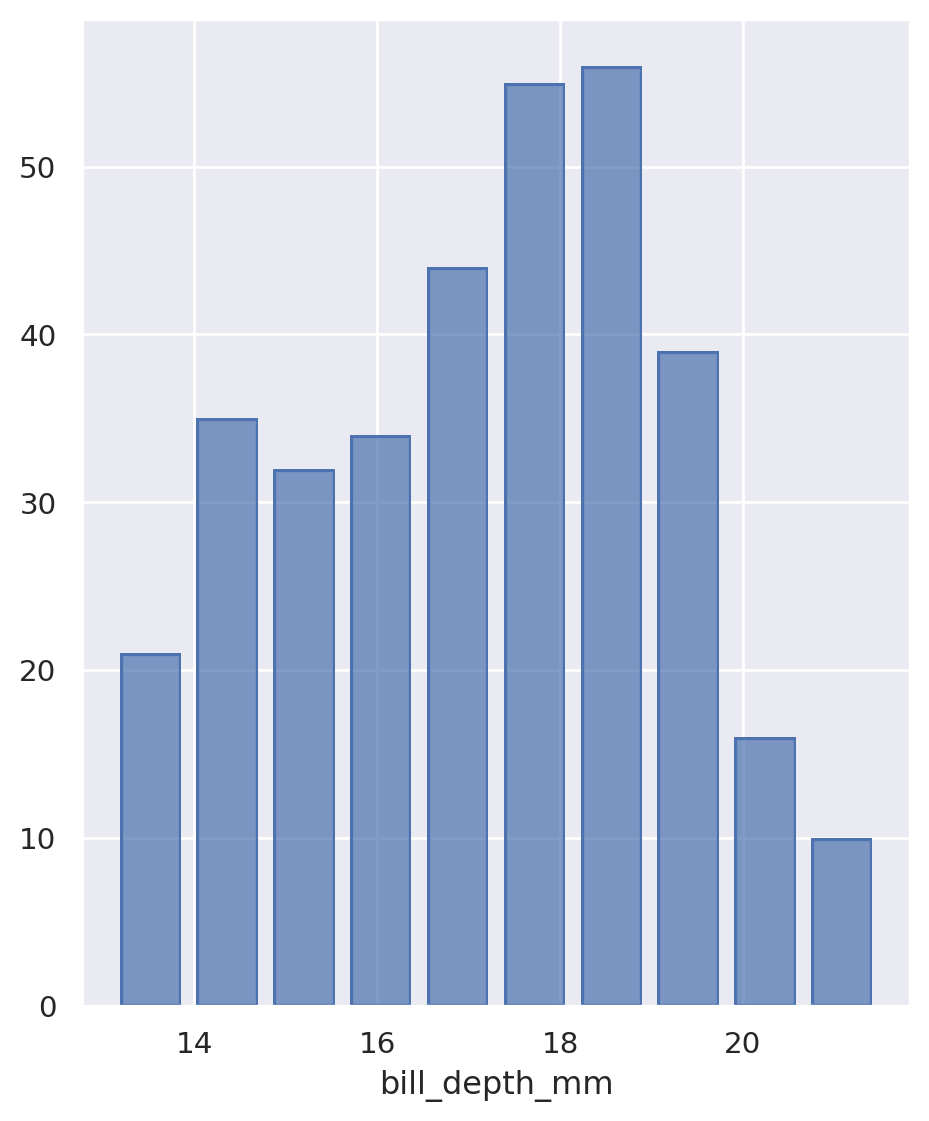
Histogram
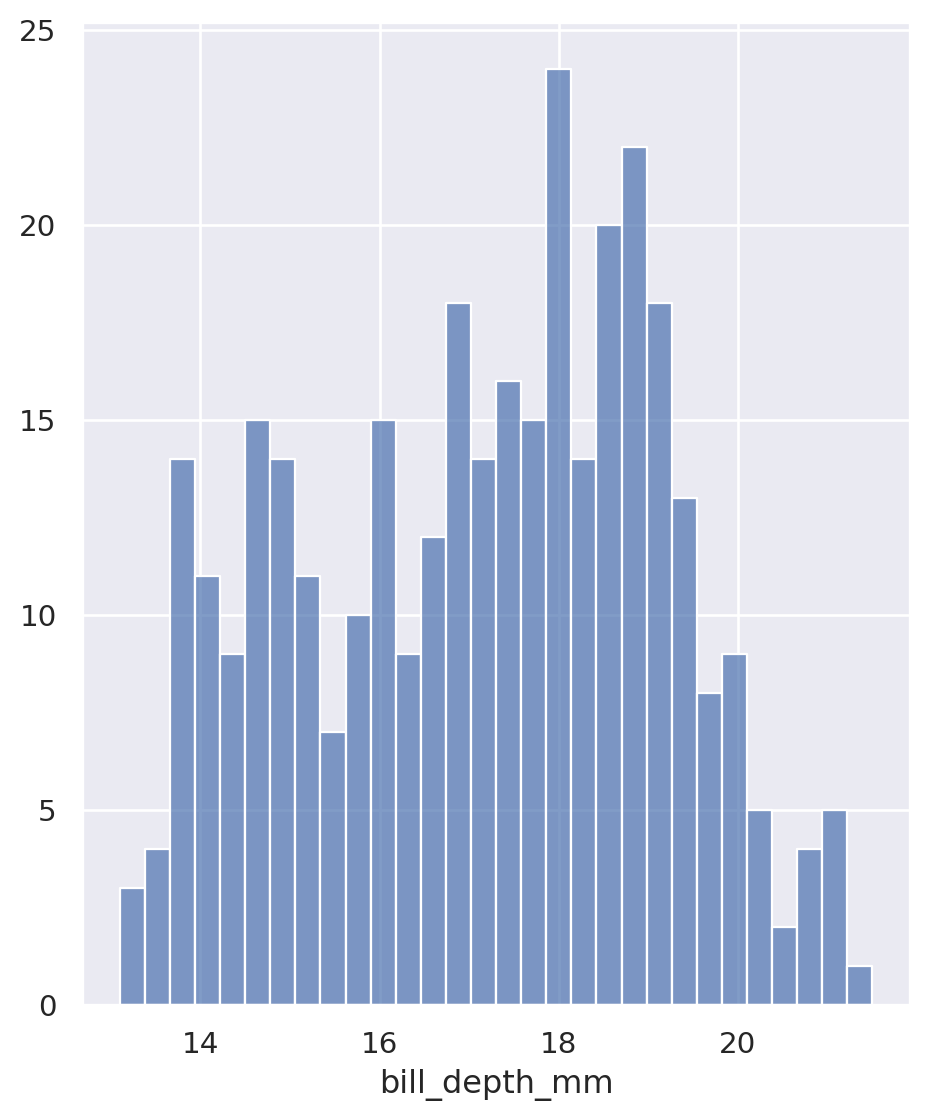
Histogram
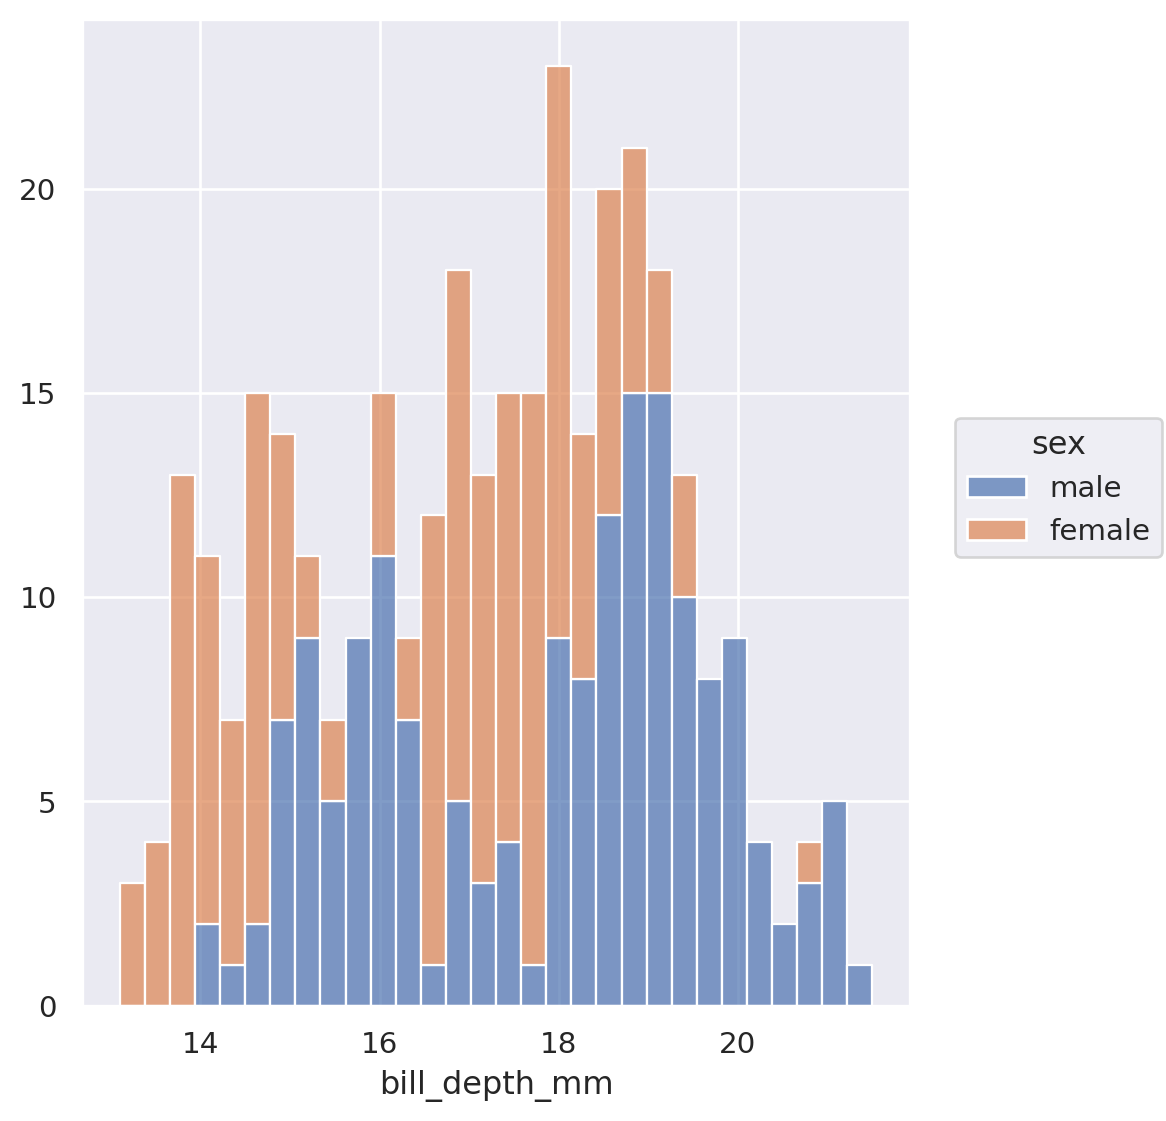
Histogram
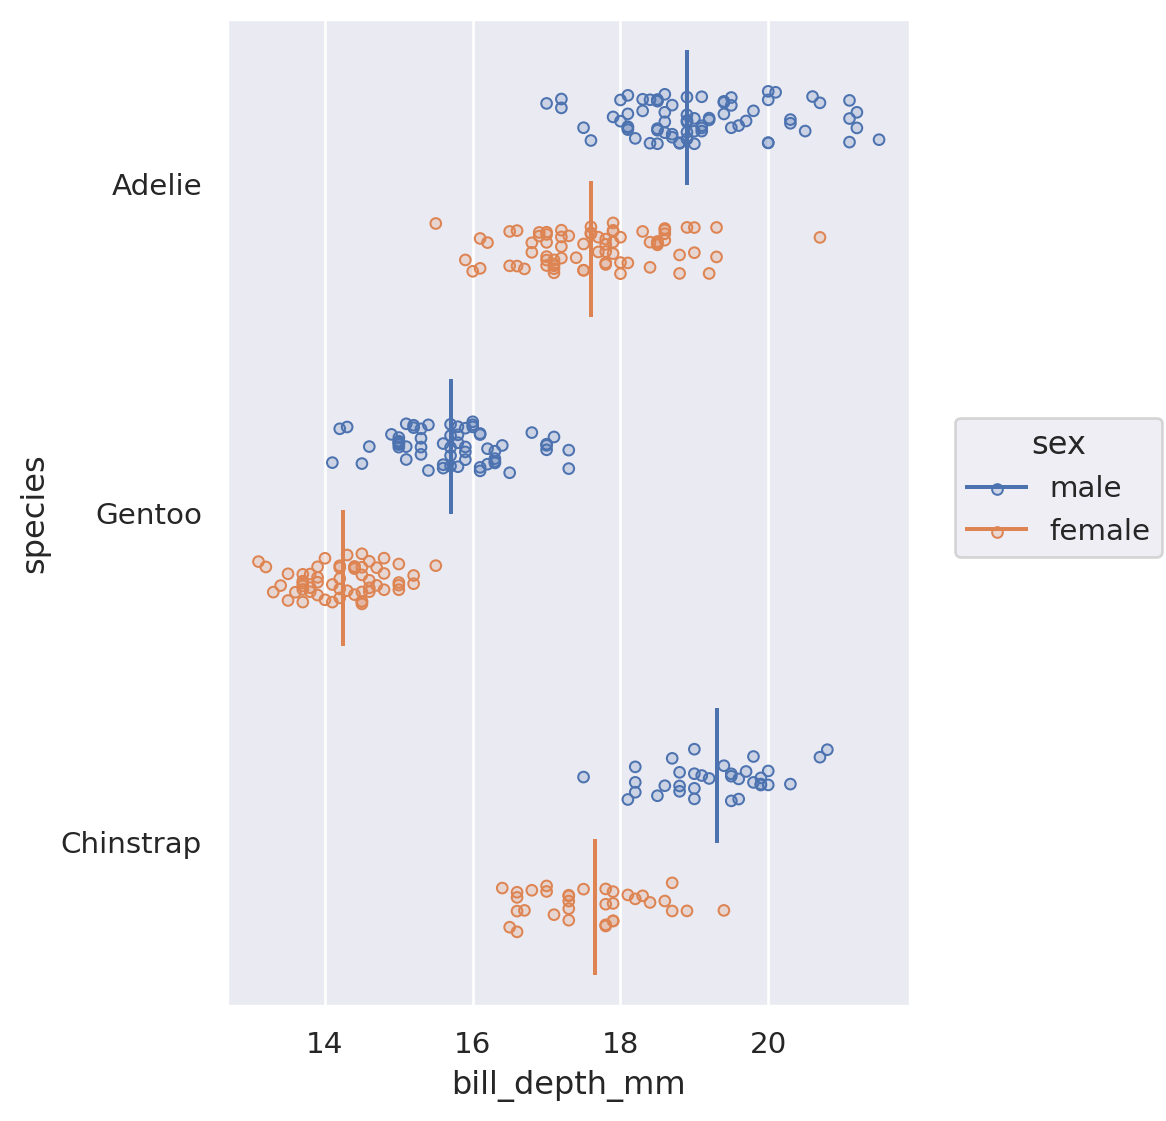
Stripchart
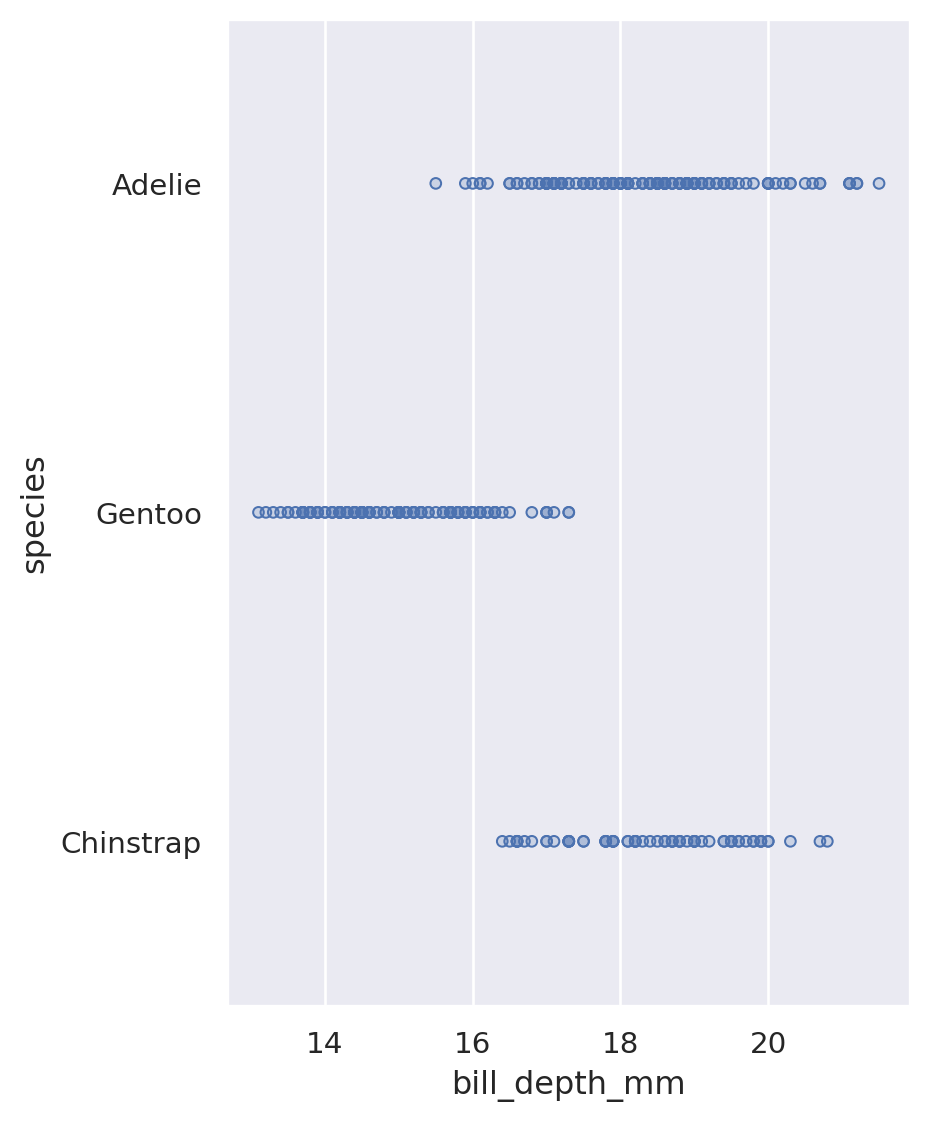
Stripchart
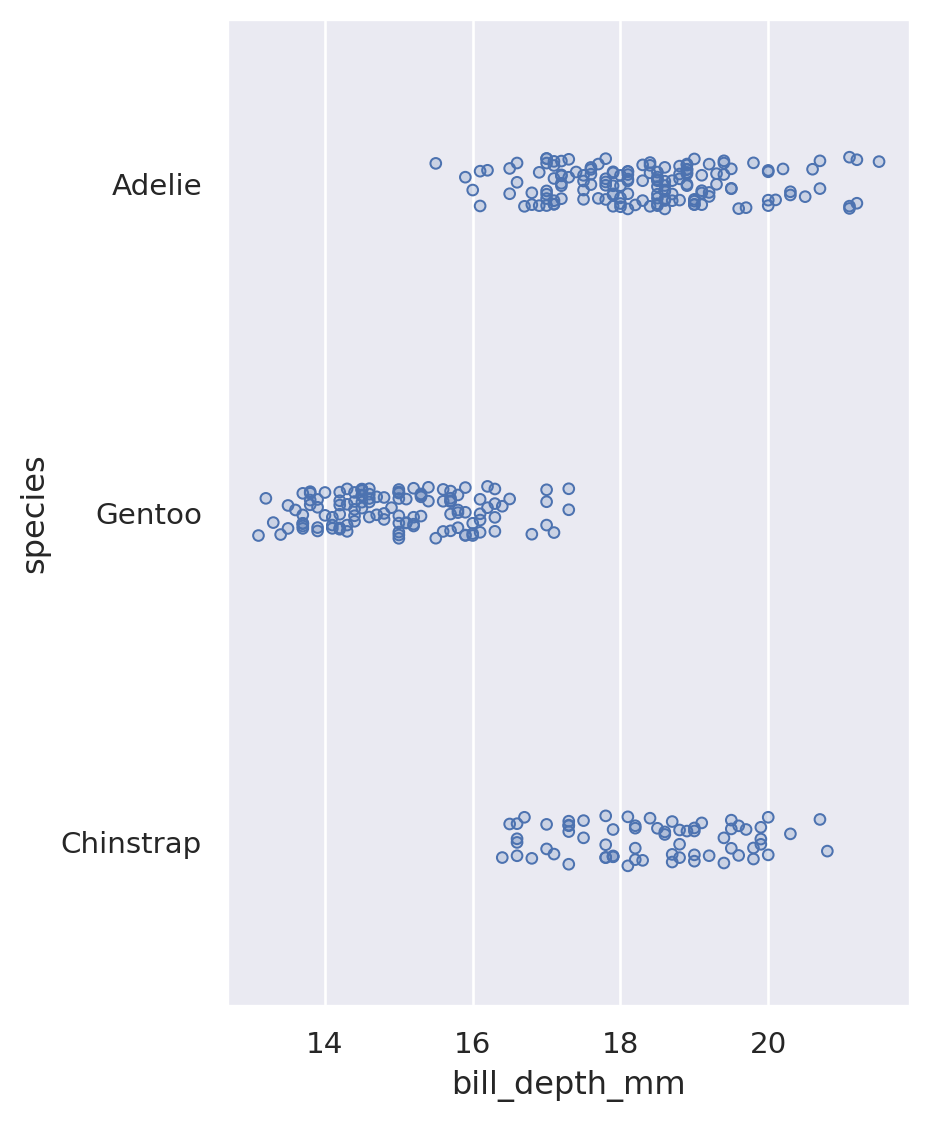
Stripchart

Stripchart
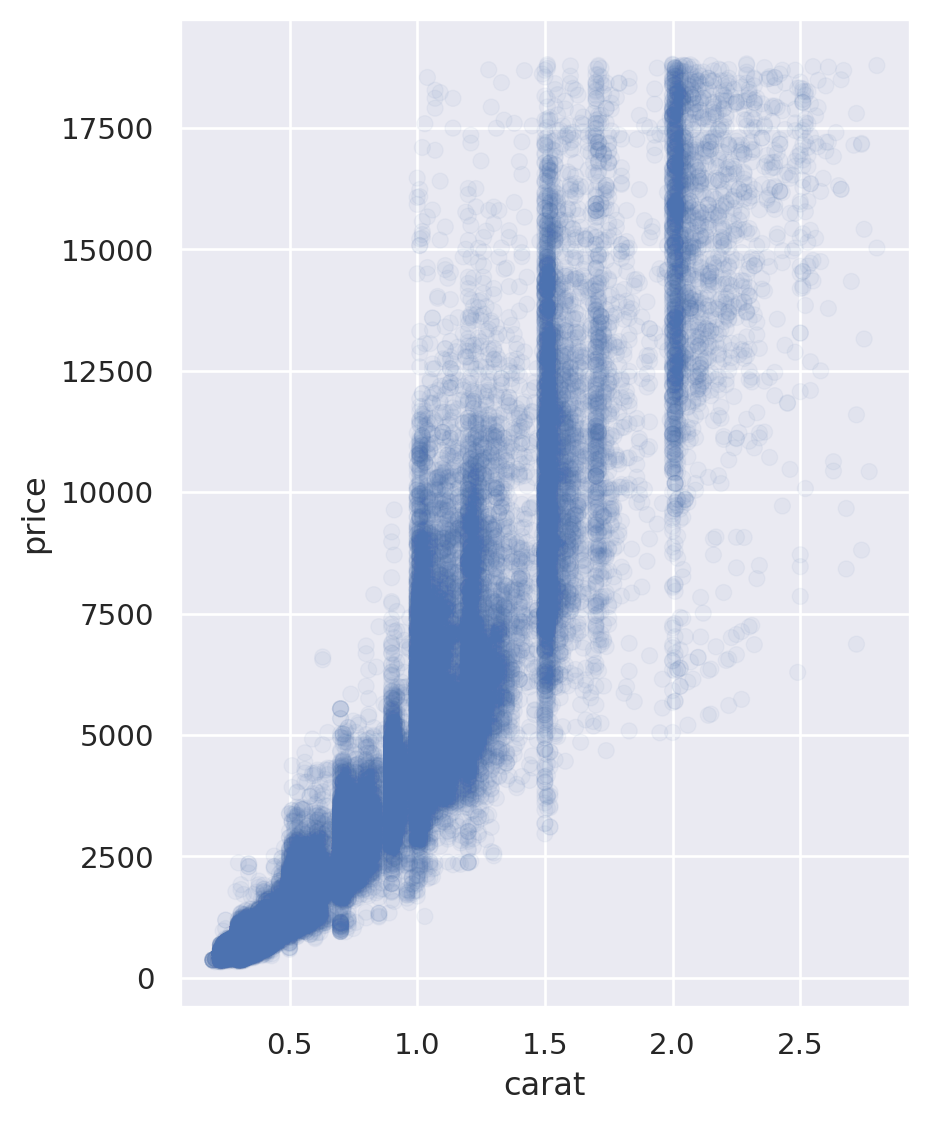
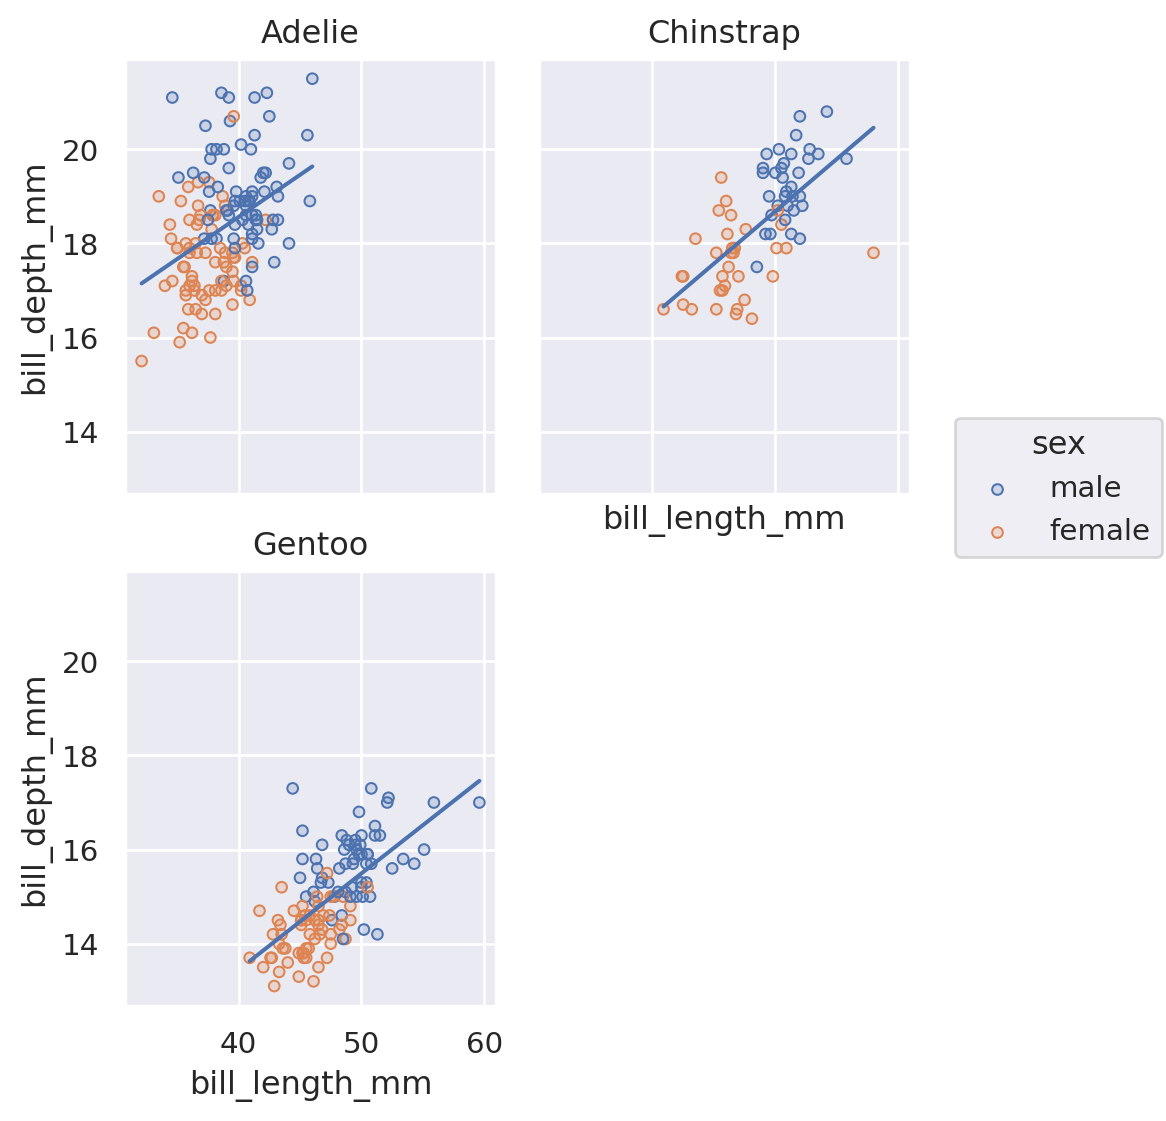
Scatterplot
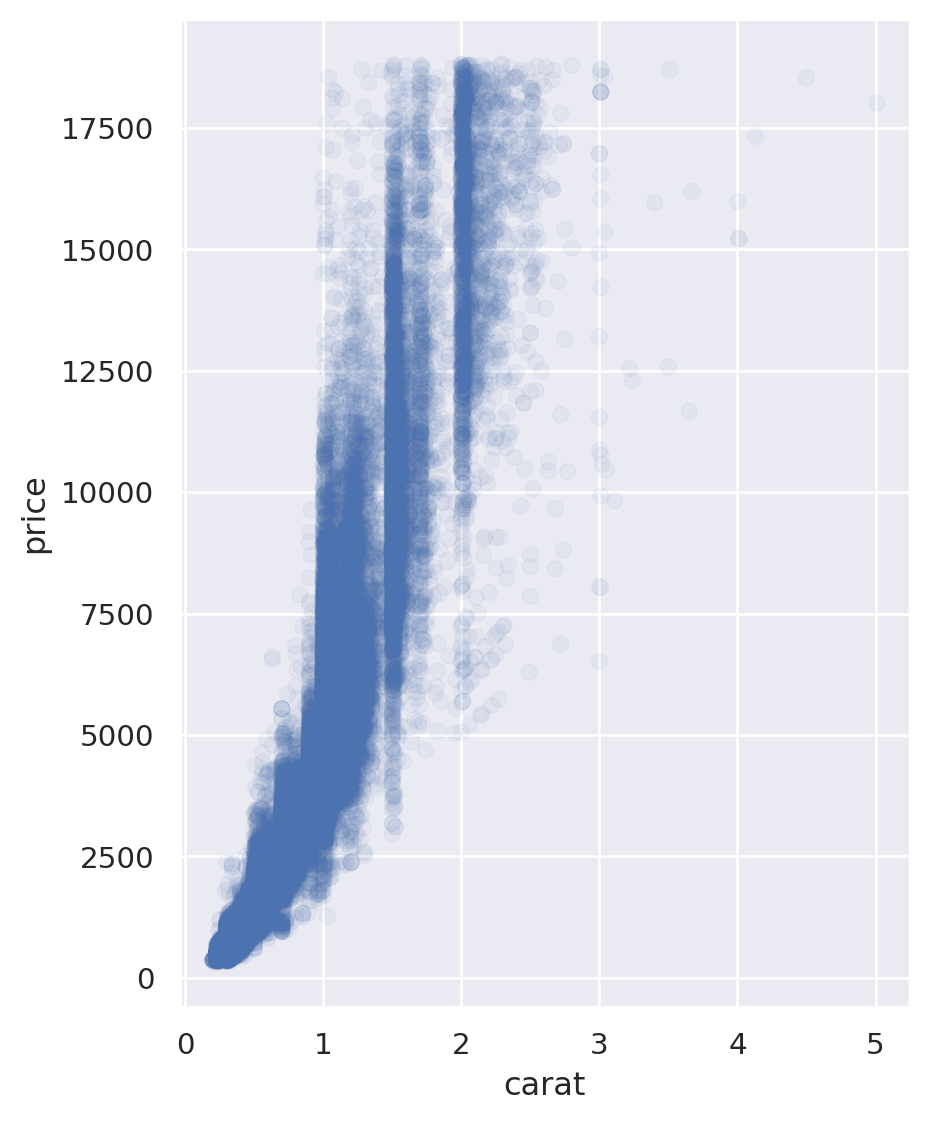
Scatterplot
Scatterplot
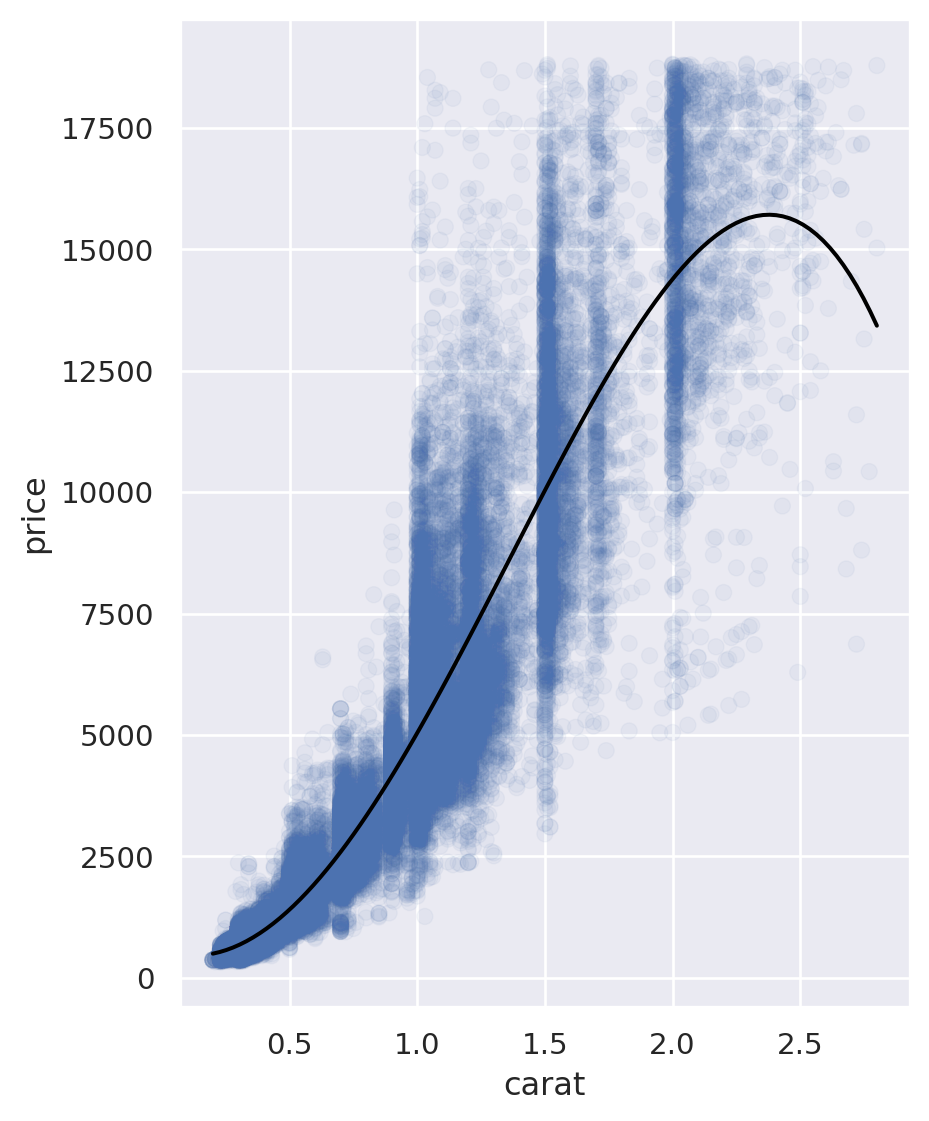
Scatterplot
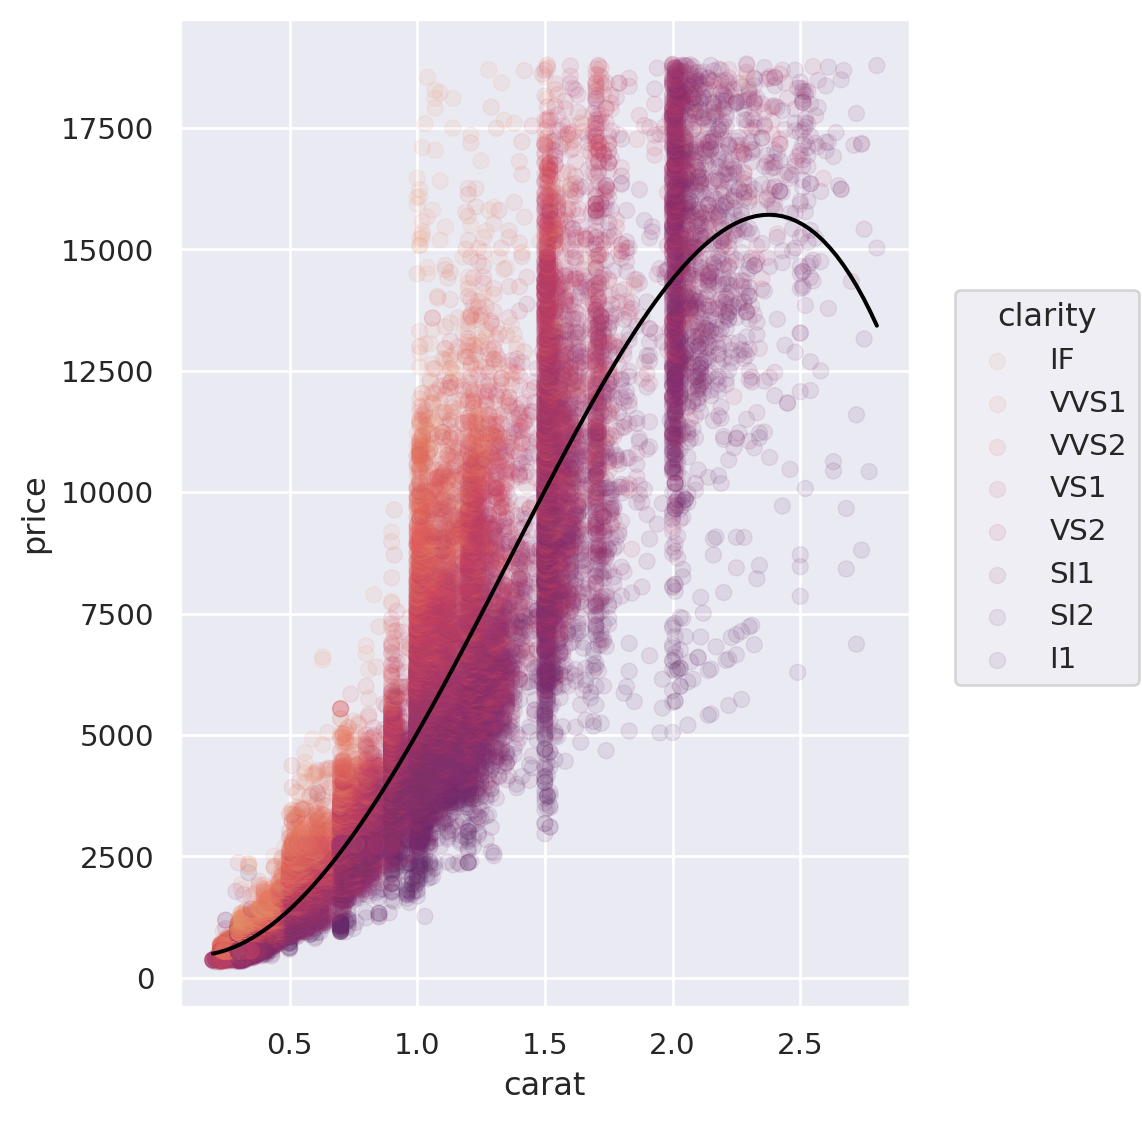
Scatterplot
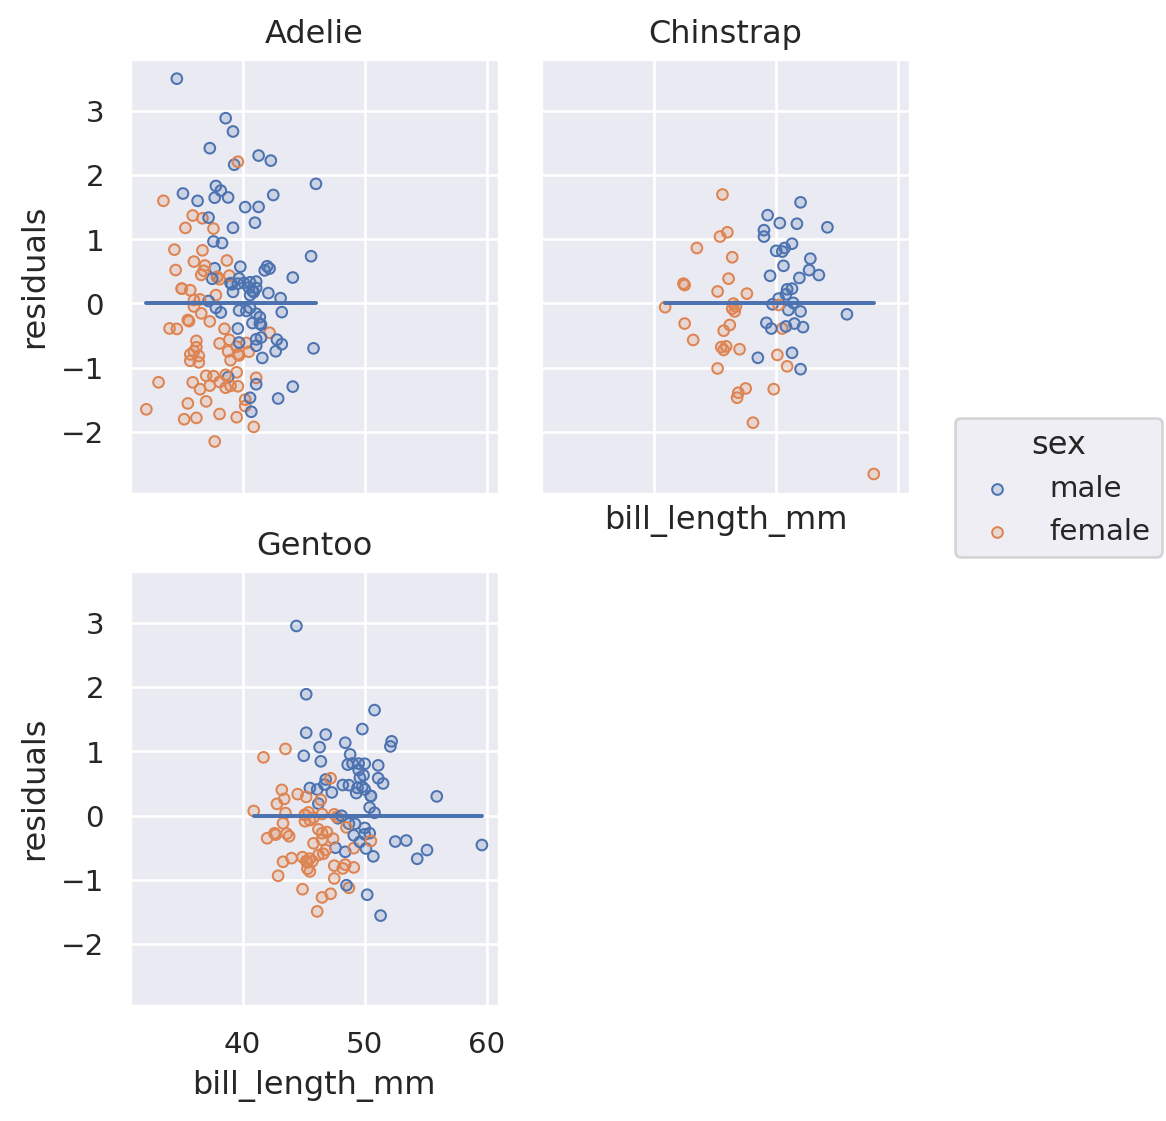
Residual Plot
Residual Plot
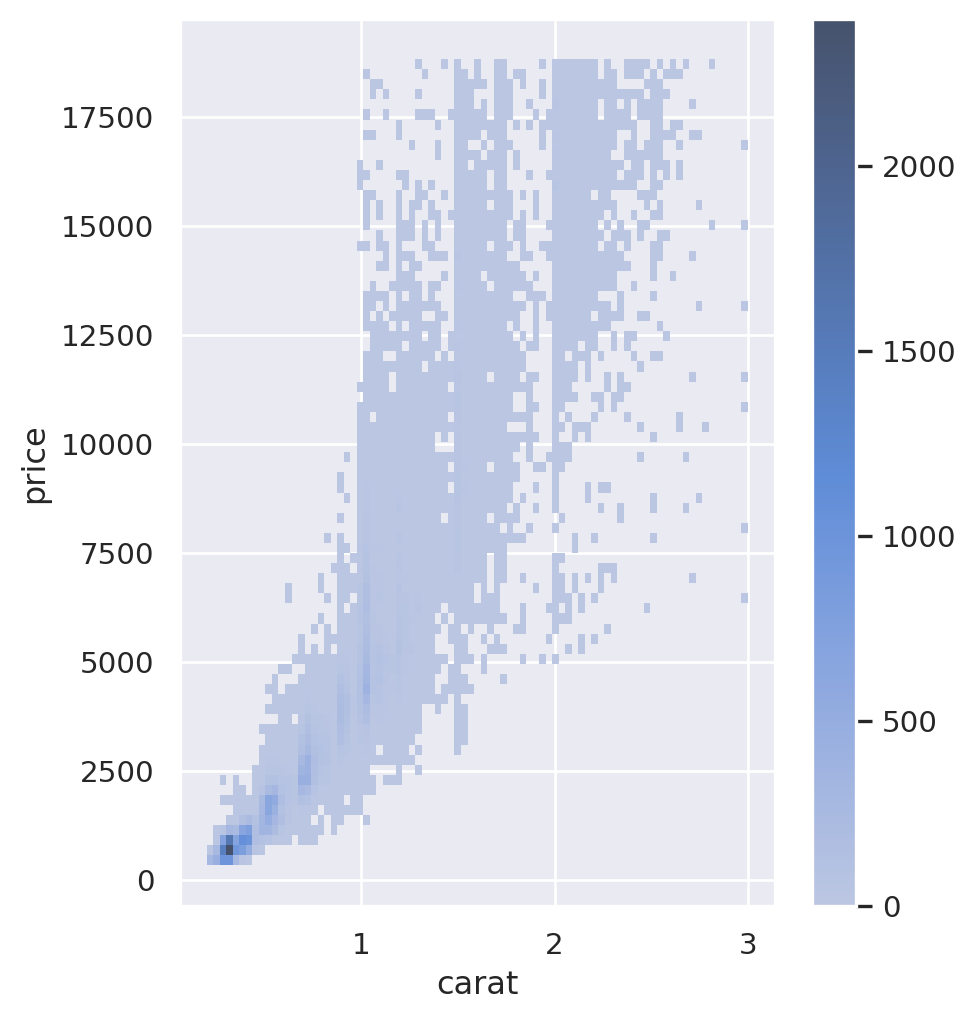
Heatmap
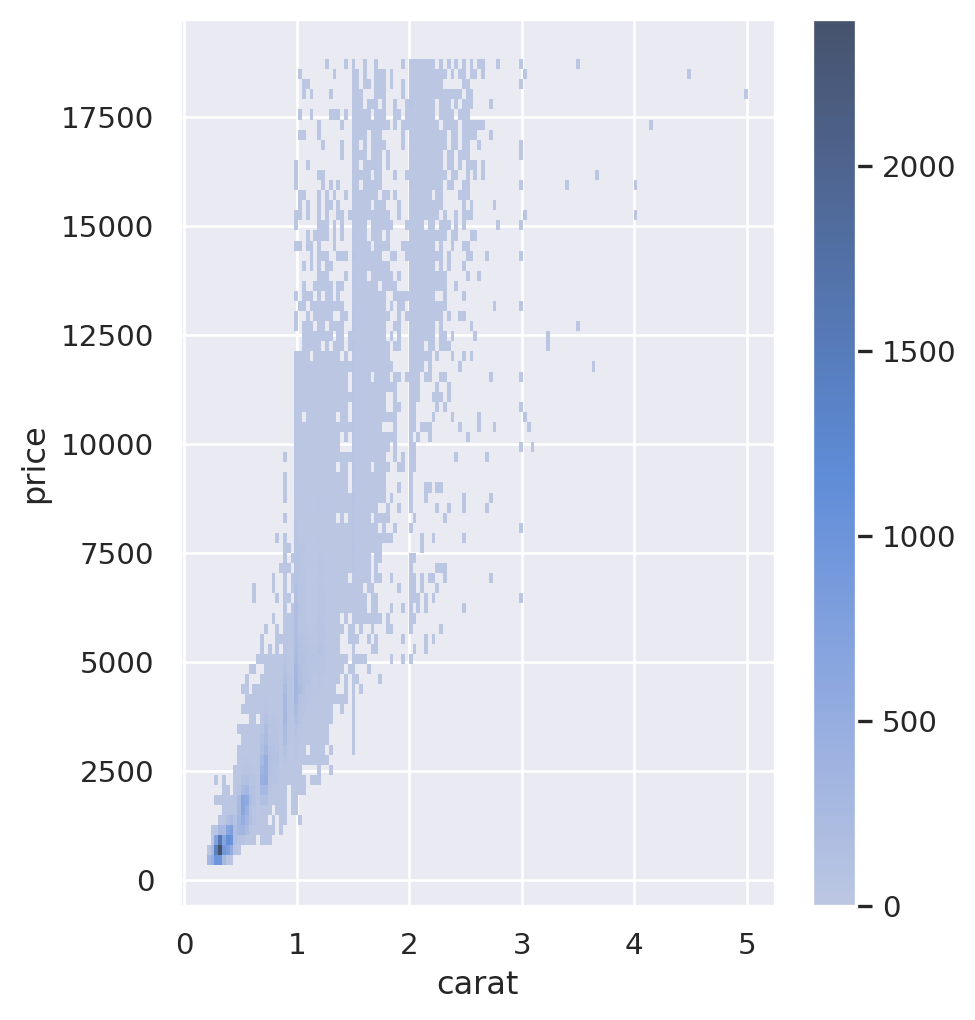
Heatmap
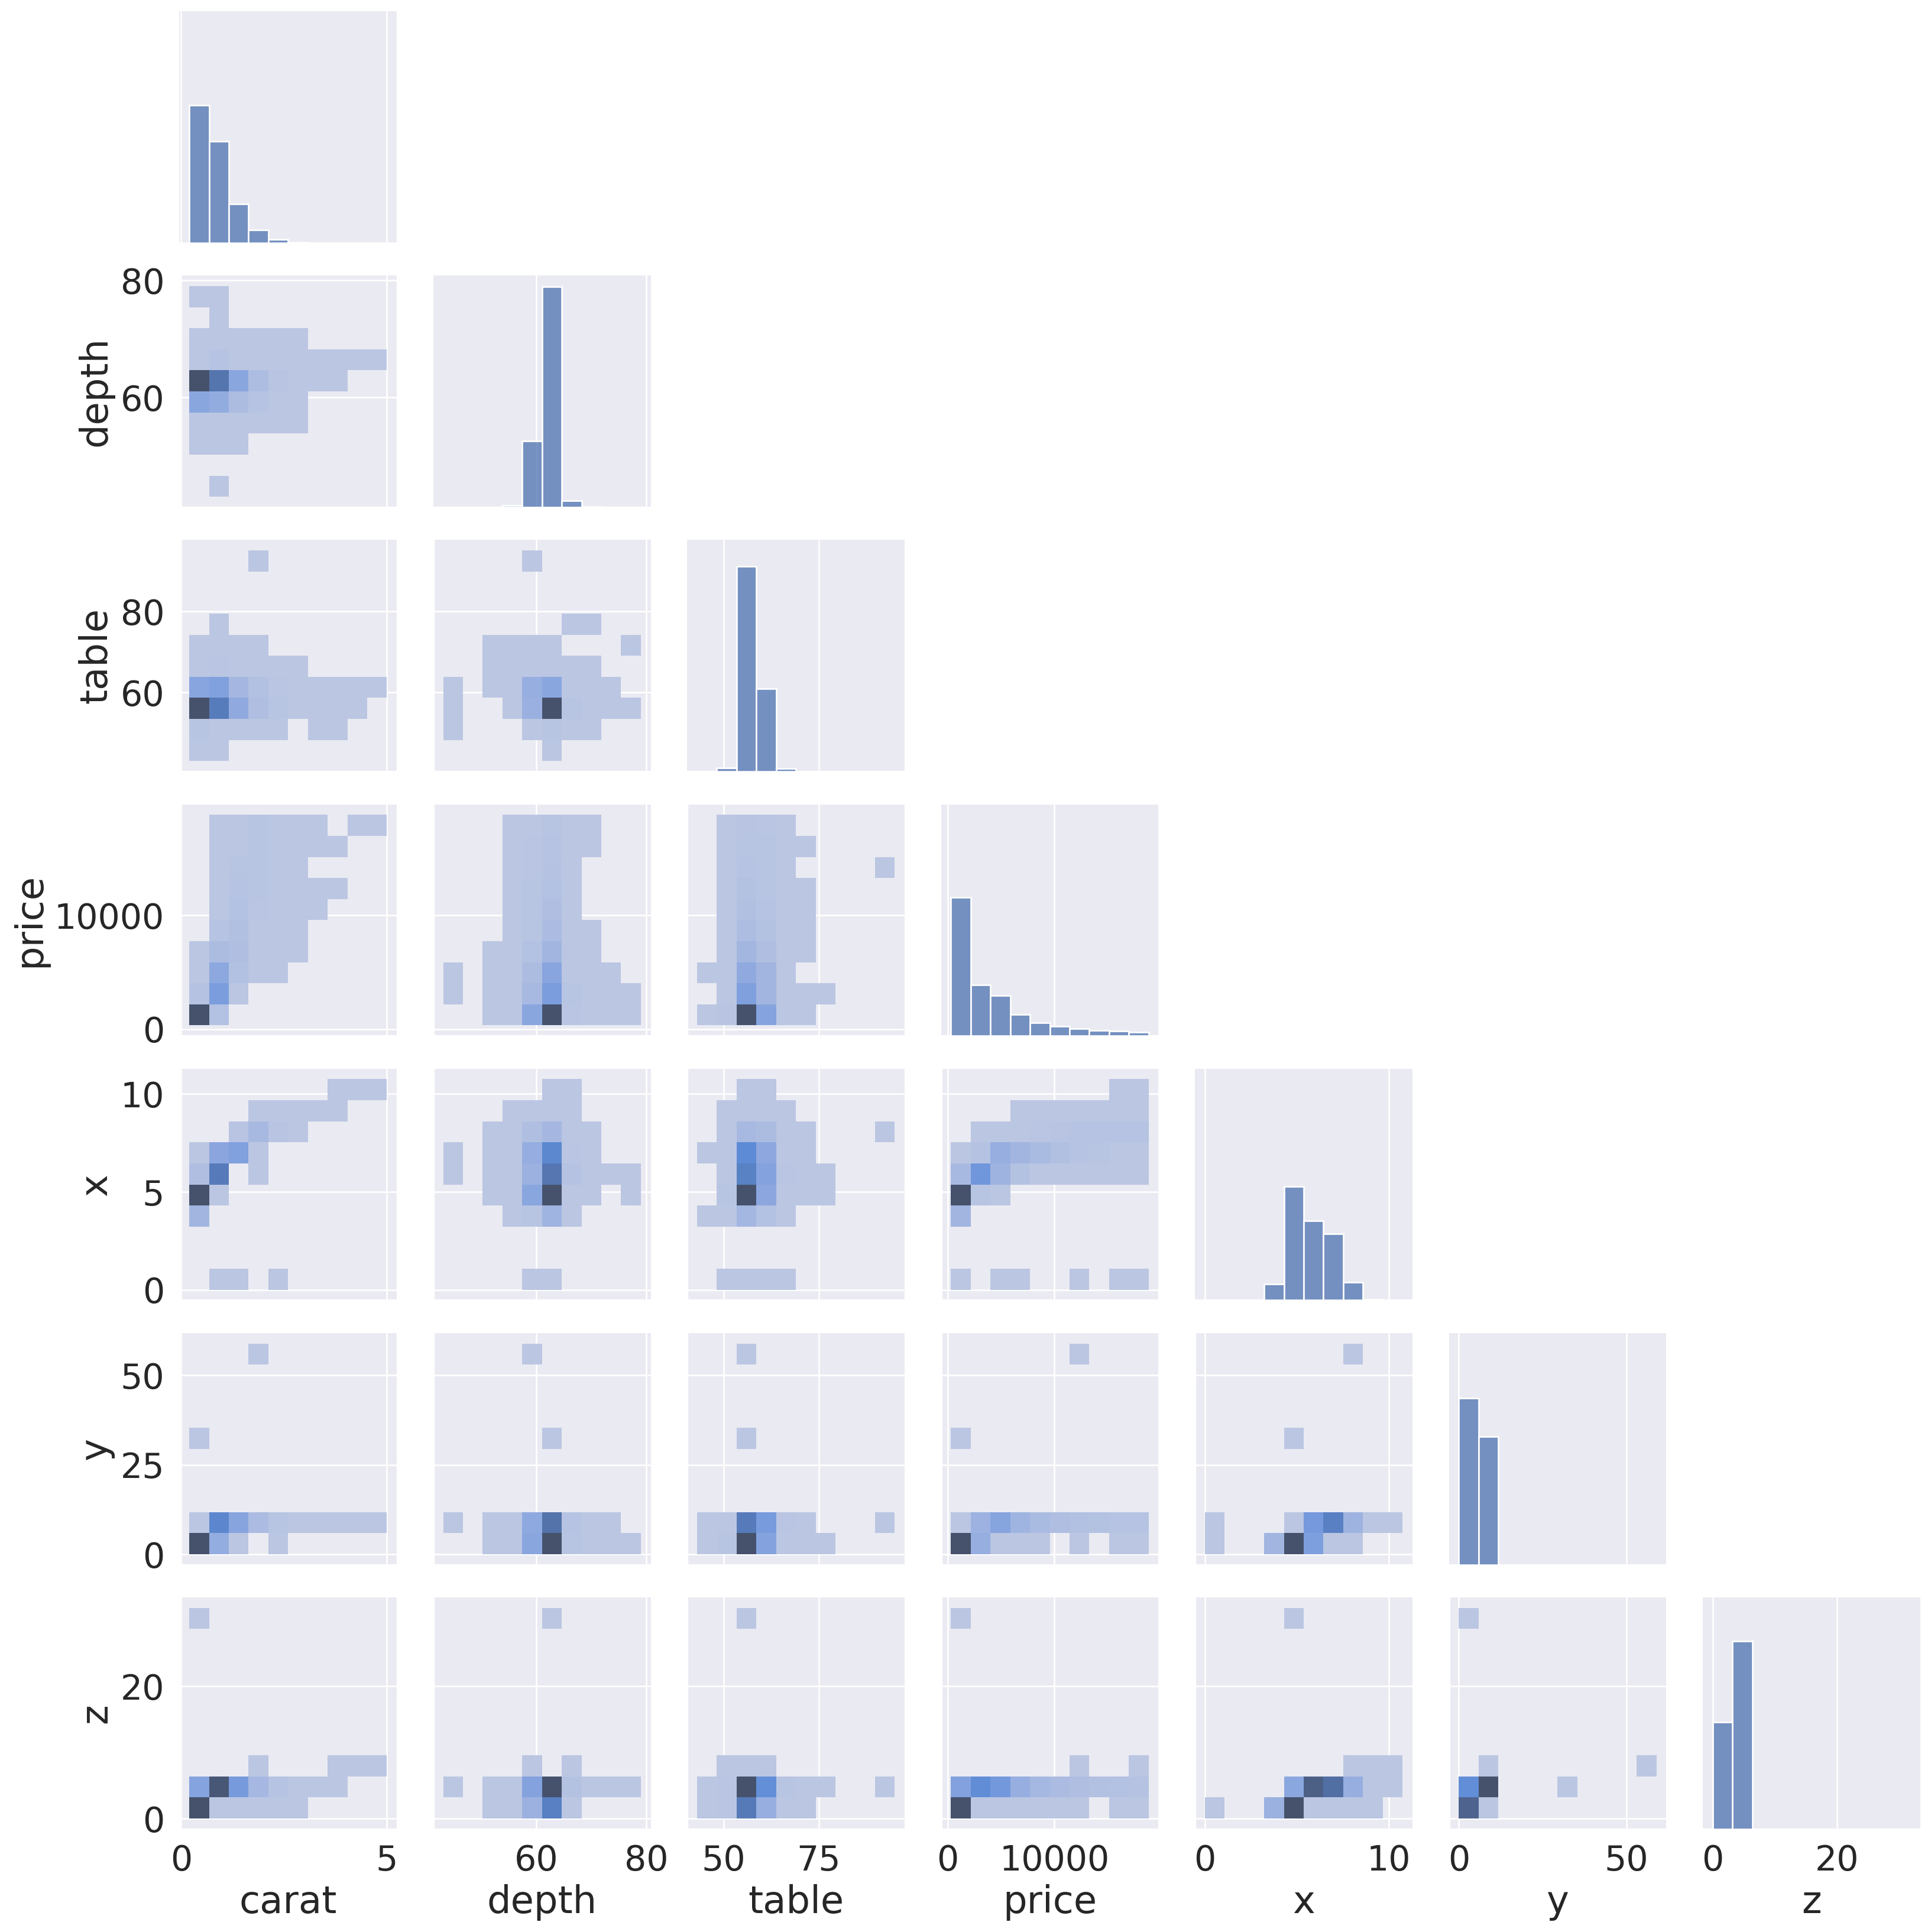
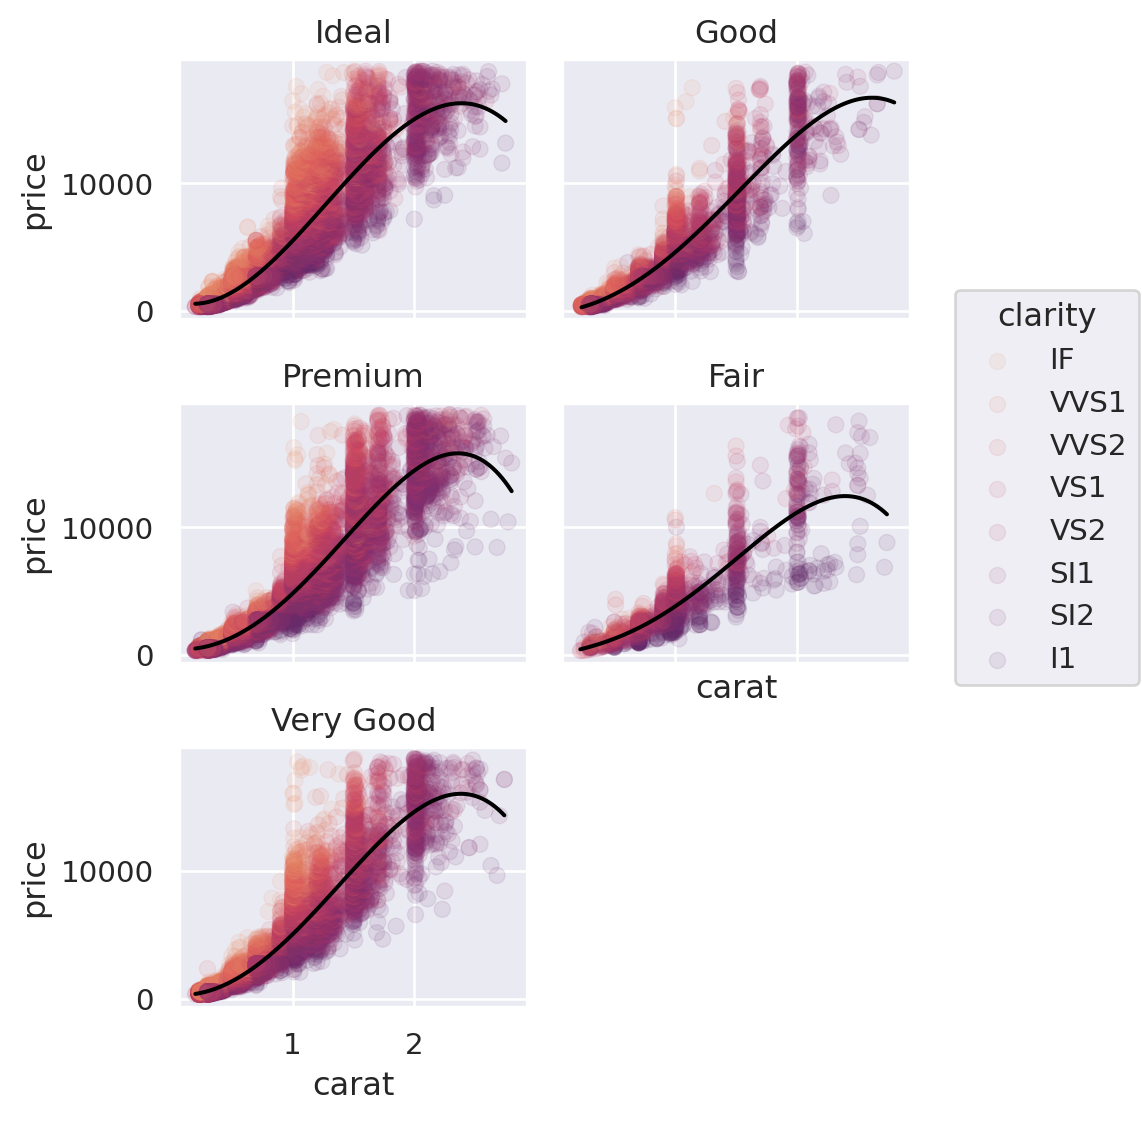
Pairs
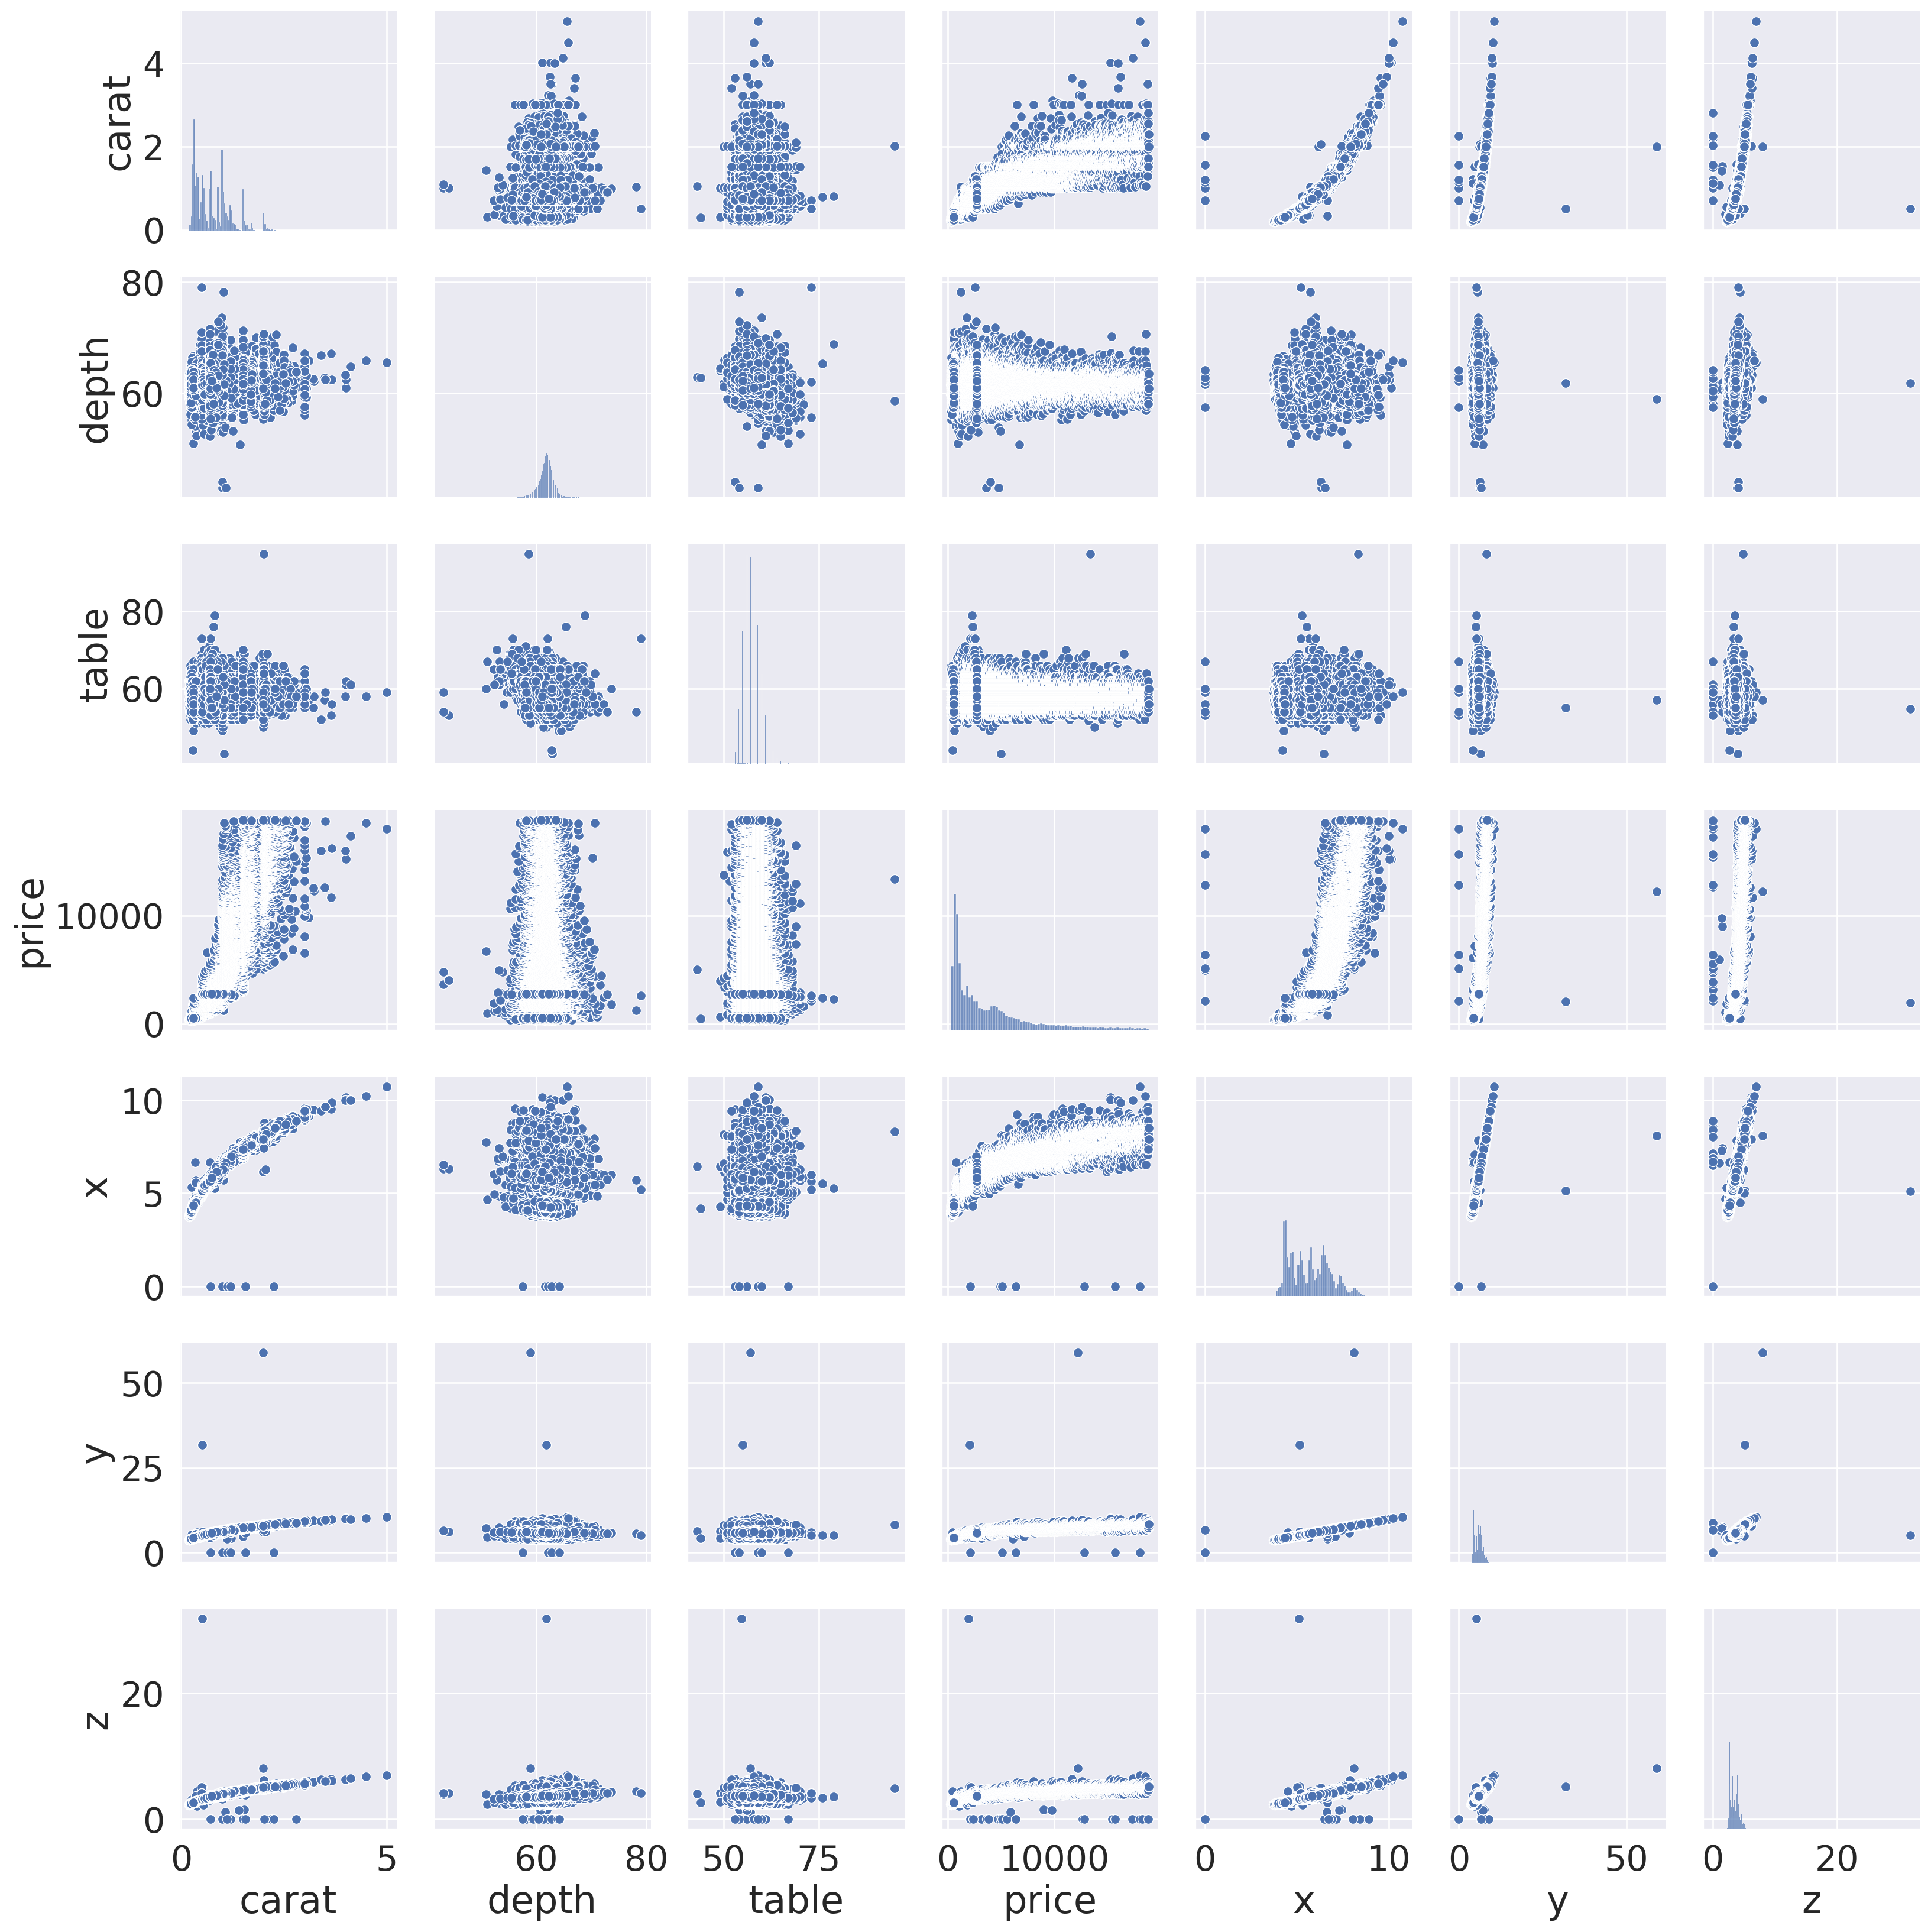
Pairs